Executive Summary
- Growth expectations are set to exceed consensus estimates for the US economy.
- Household and corporate balance sheet strength are essential pillars of a strong US economy.
- Income and consumption are recovering alongside the broader economy.
- The labor market is tight but worsening at the edges.
- Productivity is a crucial driver supporting the bullish economic growth argument.
- Overall outlook: strong growth, decreased labor contribution.
- Inflation is expected to remain stubbornly high but continues to ease gradually.
- Housing and wages are helping to slow inflation.
- AI-driven productivity serves as a major disinflationary force.
- Tariffs do not guarantee a renewed surge in inflation.
- Persistent high inflation keeps the Fed cautious, and markets expect easier policy than the FOMC dot plot shows.
- Fed leadership transition to steer policy direction.
- Liquidity requirements make balance sheet normalization more complicated.
- Weakness in the labor market raises the likelihood of a jobless recovery.
- Fiscal stimulus and deregulation encourage growth.
- Monetary and fiscal policies are increasingly linked.
- Strong earnings and revenue exceed expectations.
- Earnings growth sector leadership is focused on Tech, Industrials, and Communications Services.
- Clear outperformance by globally exposed companies driven mainly by a weaker US dollar and improved translation effects.
- Mixed guidance and revisions are constructive, and forward estimates and valuations are trending upward.
Dedicated Investment Team:
Andrew Cunningham, CFA®, CMT®, ChFC®
Chief Investment Officer
512.457.7534
andrew.cunningham@plainscapital.com
Central Texas
Kendall Parker
Manager of Investment Services
214.252.4165
Kendall.parker@plainscapital.com
Dallas
Stephen Schaller, CFA®, CFP®
Market Manager, Portfolio Manager
713.749.8113
stephen.schaller@plainscapital.com
Houston/ Coastal Bend
Jerrod Dawson, CFA®
Manager of Investment Strategies and Portfolio
214.252.4120
Jerrod.dawson@plainscapital.com
Dallas
Victor Tanguma, AIF®
Senior Portfolio Manager
956.661.5466
victor.tanguma@plainscapital.com
McAllen/ Rio Grande Valley
Larry Smith
Senior Portfolio Manager
806.791.7256
larry.smith@plainscapital.com
West Texas
Irene Silva, AWMA ®
Portfolio Manager
817.258.3818
irene.silva@plainscapital.com
Fort Worth
Triana Ramon
Analyst
214.252.4166
triana.ramon@plainscapital.com
Dallas
Morgan Cook
Analyst
817.258.3705
morgan.cook@plainscapital.com
Fort Worth
US Economic Cycle Drivers

US & Global Economic Highlights
U.S. growth is expected to continue to exceed expectations, driven by household and business resilience and a strong boost in productivity. However, these gains might come with fewer jobs, which could impact income distribution and the sustainability of consumer spending.
The growth outlook is likely much stronger than what consensus economists predict. Research indicates a multi-year recovery in 2026–27, supported by simultaneous fiscal, monetary, and regulatory easing, along with the potential for sustained above-trend productivity. In contrast, the consensus near ~2% is considered 40–50% too low, suggesting that positive surprises are likely to continue, boosting risk assets and earnings. Household balance sheets remain historically strong, reducing near-term recession risk and providing a cushion for spending during a U-shaped slowdown in income and consumption. This resilience is a key link to the next phase of the cycle. Corporate balance sheets are also solid, with few private-sector imbalances or excesses, reducing the recession risk and supporting capital expenditure and profitability as growth accelerates. While tariffs influence inflation calculations, they account for only a small share of economic growth, limiting their negative impact compared to the broader, pro-growth environment currently in place.
Income dynamics are improving as the economy recovers from the slowdown. However, the composition matters: private-sector labor income has increased somewhat, but the underlying weakness in employment growth is masked by income figures, underscoring the need to monitor broader hiring trends.
The signals from the labor market are subtle: claims and the broader business cycle suggest a low chance of a recession, but a sharp drop in job openings and the ongoing effects of an aggressive policy rate hike increase the likelihood of an expansion with slower hiring growth. Productivity remains crucial. The current upturn is surpassing previous major cycles, and AI-driven diffusion could boost productivity, acting as a tailwind for profits while reducing inflation—historically, higher productivity has supported corporate profitability and earnings with beneficial delays.
Recent data show a mixed but improving macro environment: hiring has slowed as job openings decline, large-firm payrolls remain flat, and claims increase slightly, while healthcare hiring—once a stronghold—shows signs of softening; with wage pressures subdued, consumer spending remains the most stable GDP component but becomes more uneven at the margins as autos declined in January, partly due to weather (labor: Neutral; consumer spending: Asset; consumer confidence: Neutral).

High-frequency labor indicators show a stable job market at the start of 2026. WARN layoff notices and claims trends reveal “no evidence of firing,” while ADP’s weekly gauge indicates hiring has paused but not worsened. This suggests that labor income continues to support spending, as evidenced by strong, high-frequency consumer outlays. Dallas Fed’s high-frequency activity measures also point to sustained U.S. momentum into early Q1, aligning with a soft-landing expansion rather than a contraction.
Manufacturing activity has increased as ISM and regional surveys return to growth, and industrial production improves, while capital substitution and AI-related equipment spending continue to support capex momentum (manufacturing: Asset; capex equipment: Asset).

Manufacturing shows early signs of improvement. The ISM Manufacturing PMI rose to 52.6, with notable gains in New Orders and Production—both key indicators that usually lead to broader industrial growth. The gap between New Orders and Inventories is narrowing, regional Fed data indicate expansion, and both orders and hours worked are increasing, suggesting factory activity has turned a corner. Supporting indicators—more rail carloads, increased confidence in equipment leasing, and a weaker dollar—generally support future PMI gains and strengthen the case for an industrial rebound.
Cyclical sectors are gaining momentum. Historically, during past new PMI expansions, key macro indicators like industrial production, retail sales, and real PCE have usually strengthened over the next 6–12 months, a pattern that aligns with the current outlook. Housing sentiment (NAHB) stays above 50 and is climbing; mortgage applications are getting better as rates drop, and trade data show signs of stabilization in freight volumes. Housing seems to be tentatively stabilizing as existing sales increase amid eased supply constraints, justifying an upgrade to Neutral (housing: Neutral).

Credit conditions are divided—household pressure shows in BNPL and cards, while corporate spreads remain near cycle lows—so overall, the environment stays Neutral (credit environment: Neutral).
Policy and sentiment are mixed but still manageable. Business surveys (NABE) show an improving diffusion index, which generally correlates with stronger short-term GDP, and CEOs remain optimistic about higher hiring and revenue over the next year. However, policy uncertainty remains high relative to 2018–2019, and CEO confidence has declined, underscoring that the recovery depends on clearer policy signals.
External and fiscal accounts are the main obstacles: a larger current account deficit, driven by aggressive trade interventions, and a high budget deficit pose medium-term risks, even without immediate crowding out (current account deficit: Liability; budget deficit: Liability).

Implications for Q1 GDP: Combined, strong employment, steady high-frequency spending, and an emerging manufacturing and cyclical recovery suggest positive real GDP growth in Q1. While uncertainty may slow progress, the broad range of early-cycle signals indicates activity above stall speed, with domestic demand leading and inventory movements potentially providing slight support if new orders continue to exceed production.

US Inflation Review and Outlook
The baseline scenario indicates that U.S. inflation will likely stay sticky in the high 2s to low 3s range, with Core PCE and headline CPI remaining within that range since late 2023. However, the risk distribution slightly favors a lower path if AI-driven productivity gains continue; in a productivity boom scenario, equilibrium Core PCE could even fall into the high 1s.

In the near term, the main disinflationary headwinds are centered on shelter and housing—where leading indicators show a continued easing in the Shelter CPI and Housing PCE—and on wages, where an AI-related jobless recovery could curb labor turnover and slow wage growth, reducing cost-push pressures. We remain doubtful of the consensus “tariffs → reacceleration” narrative, noting that tariff trends are likely to put downward pressure on inflation over the medium term. This, along with housing and wage disinflation, suggests there is little chance of a near-term rise in underlying inflation without other shocks.

From a perspective of consensus versus expectations, consensus underestimates the resilience of this sticky but gradually easing profile; inflation is the most lagging indicator of the business cycle and is unlikely to return sustainably to 2% without a formal recession—thus, the most probable outcome is elevated but contained inflation rather than a quick return to target. The AI/productivity channel is crucial: a sustained rise in productivity both mechanically dampens inflation and raises the likelihood of a “jobless recovery,” with slower job switching and lower labor-cost inflation reinforcing disinflation. If productivity diffusion proves stronger than expected, the downside risk is a more deflationary bias in prices.
Secular inflation risks remain high: persistence around the high 2s and low 3s can continue even as growth improves, and without a recession, the final effort to reach 2% is challenging; additionally, headline and producer price inflation are more likely to behave unpredictably if there’s an energy price shock, which could offset wage and housing disinflation.
In summary, the outlook for cyclical inflation is for a gradual decline—mainly driven by housing and wages, supported by AI-related productivity gains and tariff impacts—but it will likely remain above the Fed’s target unless there’s a downturn. The faster spread of productivity improvements relative to the risk of commodity surprises skews the risks.
Inflation figures remain persistent and are complicated by data issues, with oil price increases adding risk, but supply chain pressures remain moderate. The policy rate is on hold near neutral, and Treasury yields are rangebound.

The missing link: The race between productivity and inflation is on
U.S. productivity has improved significantly, with revised nonfarm productivity rising at a 4.9% annualized rate in the third quarter, helping to reduce unit labor costs by 1.9%. This eases inflation pressures, even as increasing oil prices reintroduce upside risks to headline inflation and threaten recent progress if they persist.

Firms benefit from maintaining positive price-cost markups, and improving productivity supports this by reducing effective labor costs and allowing companies to keep margins even during volatile demand. This cost discipline is strengthened by ongoing corporate focus on efficiency and targeted cost-cutting measures, which further safeguard profitability against fluctuations in input prices, such as energy.

Labor market indicators show mixed signals: while headlines mention “labor market wobbles,” weekly initial jobless claims stay low, indicating underlying strength. However, JOLTS openings and quits data suggest a slowing labor market, with firms facing less hiring pressure and workers less eager to change jobs. This limits wage growth and helps keep wage-driven inflation in check.

In this context, wage inflation remains difficult to trigger until the labor market recovers further, reducing the risk of a wage-price spiral and helping firms maintain margins even as revenue growth slows. In the bond market, stability depends on anchored inflation; in the stock market, support persists as long as 10-year Treasury yields stay below about 4.5%. This threshold assumes inflation remains stable as long as oil stays around $65 per barrel and there’s no increase in housing rents and prices. The balance ultimately depends on whether productivity gains can offset potential inflationary pressures from energy and shelter, and on maintaining confidence in the policy path and long-term yields.
Critical points for the economy:
- Growth expectations are poised to surpass consensus estimates for the US economy.
- Household and corporate balance sheet strength are key pillars of a resilient US economy.
- Income and consumption are rebounding along with the broader economy.
- The labor market is tight but deteriorating at the edges.
- Productivity is a key factor fueling the bullish economic growth thesis.
- Overall outlook: robust growth, reduced labor contribution.
- Inflation is likely to stay stubbornly high but continues to ease gradually.
- Housing and wages are contributing to disinflation.
- AI-driven productivity acts as a significant disinflationary force.
- Tariffs do not ensure a renewed acceleration in inflation.
Policy Highlights
The outlook for monetary policy indicates that persistent high inflation and a restrictive policy rate keep the Fed cautious, even though market expectations suggest more easing than the median policymaker currently signals. As previously noted, inflation remains the most lagging indicator, and returning to the arbitrary 2% target is difficult without a recession. This helps explain why the median FOMC member expects fewer rate cuts than the markets anticipate and why policy continues to resist labor demand at the margin.

Leadership dynamics are essential: a potential shift toward Kevin Warsh as Chair indicates a stronger tendency to shrink the balance sheet over time and to establish a more “limited” central bank presence. This also acknowledges that lower rates become more attainable with a smaller balance sheet. At the same time, if Chair Powell remains on the board, his presence could slow or restrict the pace of easing, given his recent experience managing persistent inflation. Issues related to money and liquidity have reemerged as key factors in policy decisions, with reserve-management purchases introduced to address funding-market stress and a broader question about the Fed’s long-term role in absorbing a persistent supply–demand imbalance in Treasurys. This tension—between a stated goal to reduce the balance sheet and the ongoing system need for liquidity—shapes the range of possible easing paths.

Regarding the inflation–labor relationship, we caution that a still restrictive stance is limiting wage growth and employment opportunities, increasing the risk of a jobless recovery in which productivity—possibly boosted by AI adoption—does more of the work than hiring. This scenario would reduce labor-cost inflation and ease pressure on the Fed to keep interest rates high.

The fiscal outlook includes pro-growth measures such as tax cuts and deregulation; this policy mix is likely to support a temporary economic boom through 2026–27. However, increasing budget deficits and rising public debt could crowd out private investment and put pressure on the Treasury market, especially as foreign demand for US Treasuries becomes less reliable.
The budget balance is already deteriorating on a fiscal-year-to-date basis in 2026, with several structural factors—such as front-loaded tax relief, back-loaded spending cuts, higher true interest expenses, and geopolitical shifts reducing overseas Treasury demand—threatening to keep deficits high relative to GDP. This could raise term premia and make it more difficult for the Fed to maintain easing without renewed balance-sheet support.
Together, consensus and market expectations seem out of sync with the constraints we point out in the monetary and fiscal policy outlook: while markets favor a gentle easing cycle, the policy approach will likely be conditional, slower, and highly dependent on factors like inflation persistence, labor market softness without a recession, Fed leadership priorities, and fiscal trends that support short-term growth but risk leading to larger, more sustained deficits relative to GDP.
Critical points for policy:
- Persistent high inflation causes the Fed to stay cautious.
- Markets expect more easing than the FOMC dot plot shows.
- Fed leadership transition to steer policy direction.
- Liquidity requirements complicate the process of normalizing the balance sheet.
- Weakness in the labor market raises the likelihood of a jobless recovery.
- Fiscal stimulus and deregulation encourage growth.
- Widening budget deficit raises medium-term risks.
- Monetary and fiscal policies are increasingly linked.
Corporate Profitability Highlights
S&P 500 results are exceeding expectations, with 76% of companies beating EPS estimates and 73% surpassing revenue forecasts; overall surprises are at 7.6% for earnings and 1.4% for sales, boosting blended Q4 2025 growth to 13.0% (up from 8.3% on Dec 31) and revenue growth to 8.8%, the highest since Q3 2022.

Net profit margins have hit a record 13.2%, driven by notable year-over-year gains in Financials, Utilities, Information Technology, and Industrials, highlighting strong pricing power and operating leverage across the index. Leadership is concentrated: nine of eleven sectors show earnings growth, with major contributions from individual companies (e.g., NVIDIA in Tech; Boeing in Industrials; Alphabet in Communication Services) that account for a large share of the expansion. Meanwhile, Consumer Discretionary and Health Care trail in earnings, and Energy is the only sector experiencing a year-over-year revenue decline.

Internationally focused companies outperform their domestically focused counterparts: firms with more than half of their sales outside the U.S. report combined earnings growth of 17.7% and revenue growth of 11.9%, compared to 10.0% and 7.7%, respectively, for companies with mostly U.S. exposure; removing a major AI beneficiary lowers but does not eliminate this difference. The outperformance of international earnings results from three main factors: currency effects, strong geographic demand, and sector mix. These factors together explain why S&P 500 companies with over 50% of revenue from outside the U.S. saw higher earnings growth (17.7% vs. 10.0%) and revenue growth (11.9% vs. 7.7%) in Q4 2025 than domestically oriented firms.

Looking ahead to 2026, guidance and revisions present a mixed but generally positive outlook: in Q1 2026, 28 companies provided positive EPS guidance, compared with 23 that offered negative guidance, and analysts expect double-digit earnings growth for each quarter of 2026, averaging about 14% for the year. However, the pace of revisions has slowed slightly, as the global revisions index dipped after several months of improvement, suggesting a more selective upgrade cycle ahead, even though corporate guidance for 2026 remains optimistic.
Overall, the season shows strong revenue beats, record-high margins, a focused sector, and single-name leadership, offering a clear advantage for firms with international exposure, along with upwardly revised forward estimates—though there is slightly increased two-way revision risk as the season progresses.
Sources: BLS, BEA, Census Bureau, Federal Reserve, Strategas Research, 42Macro, FactSet, and Bloomberg
Critical points for corporate profitability:
- Strong earnings and revenue beat expectations.
- Sector leadership is focused in Tech, Industrials, and Communications Services.
- Clear outperformance by globally exposed companies.
- A weaker US dollar improved translation results.
- International demand outpaced domestic demand.
- Provides constructive but varied guidance and revisions.
- Forward estimates and valuations are trending upward.
Disclaimer
*All economic release data referenced from public sources believed to be accurate
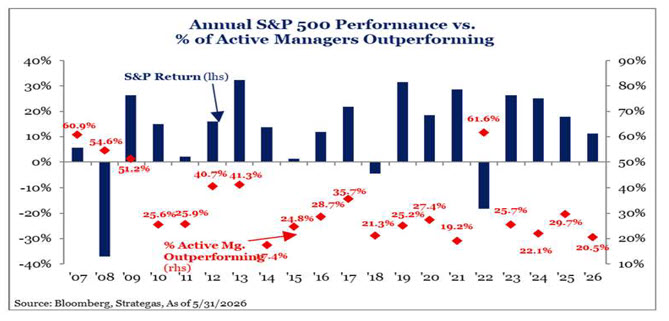
*The source of data for all charts/graphs included in this presentation is Bloomberg LP.
*Figures quoted represent monthly changes (m/m) and are seasonally adjusted
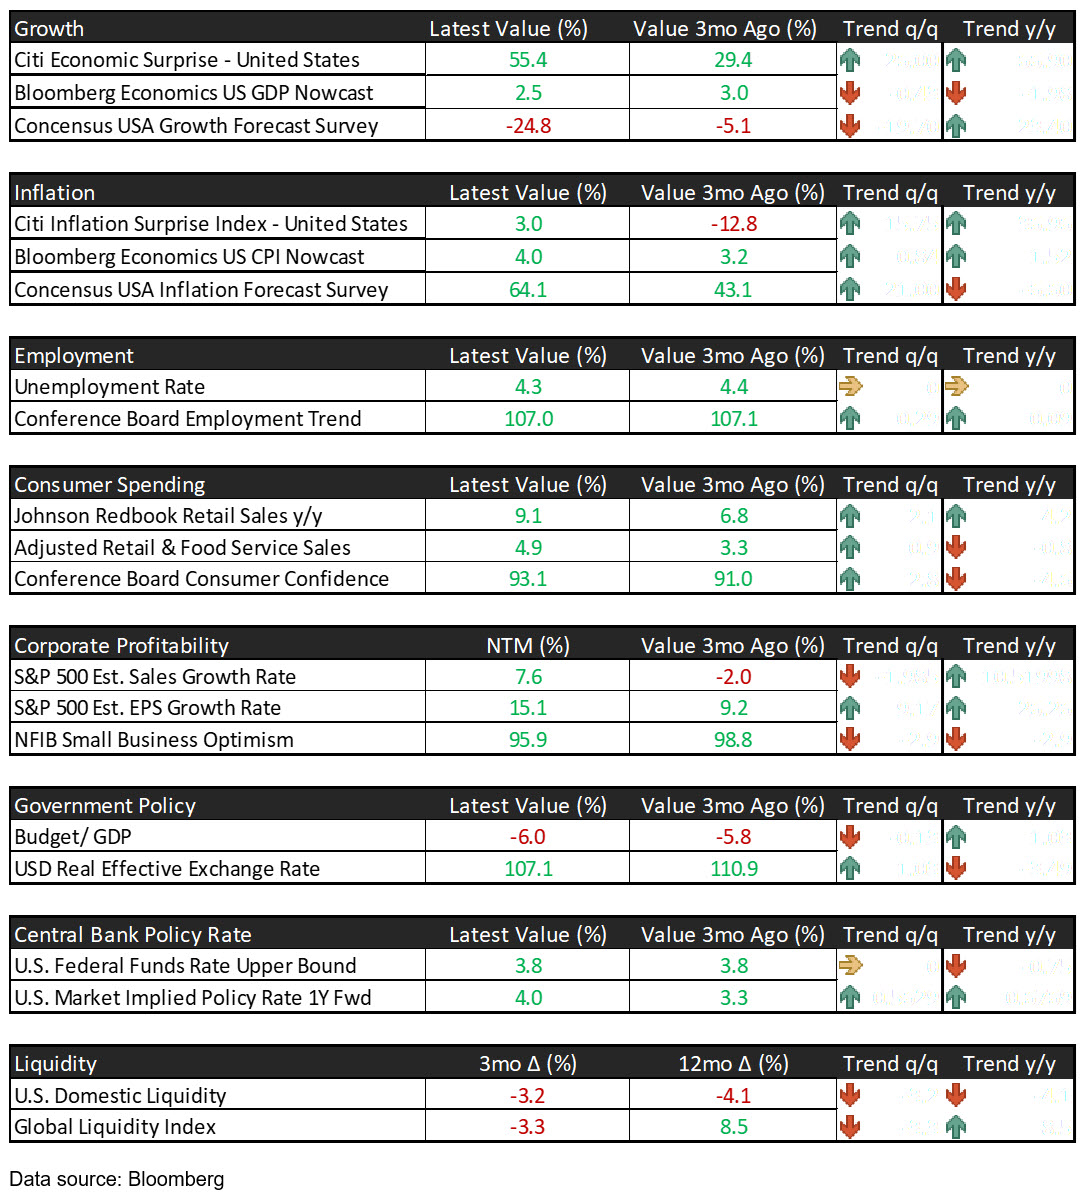
ECONOMIC HIGHLIGHTS